Dagster
Connect Dagster step by step: install the plugin, issue its key, wire in three sensors, and check it reports.
Connect it
- Choose the deployment: which environment this is: production, staging.
- Install the plugin: add convalesce-emit-dagster to your code location.
- Issue the key and set it: point the daemon at Convalesce.
- Wire the sensors in: three run-status sensors: success, failure and cancelled.
- Turn on retries, if you want them: optional: let Dagster re-execute a run once somebody approves it.
- Check it reports: run something and watch the first event arrive.
convalesce-emit-dagster tells Convalesce about every Dagster run when it finishes: what ran, how long each step took, and what it materialised.
It works through three run-status sensors that you add to your definitions: one for runs that succeed, one for runs that fail and one for runs that are cancelled. A cancelled run is recorded as skipped.
Convalesce is a hosted service. The plugin sends out to it over HTTPS, and nothing has to be opened inbound on your side.
Before you start
- Somewhere to add a Python package to your code location.
- A way to set two environment variables on the daemon and on your user-code deployments.
Connect it
In Convalesce, open Integrations, choose Dagster, and follow the steps. Each one is shown below as it looks on screen, with what to copy and run.
Set the key on the daemon and on the user-code deployments. Sensors are evaluated by the daemon, so a key missing there sends nothing. The webserver does not need it.
The steps depend on one choice: Where it runs. Pick yours here, and every step, picture and script below follows it.
A daemon started from a virtualenv.
Step 1 of 6: Choose the deployment
Which environment this is: production, staging.
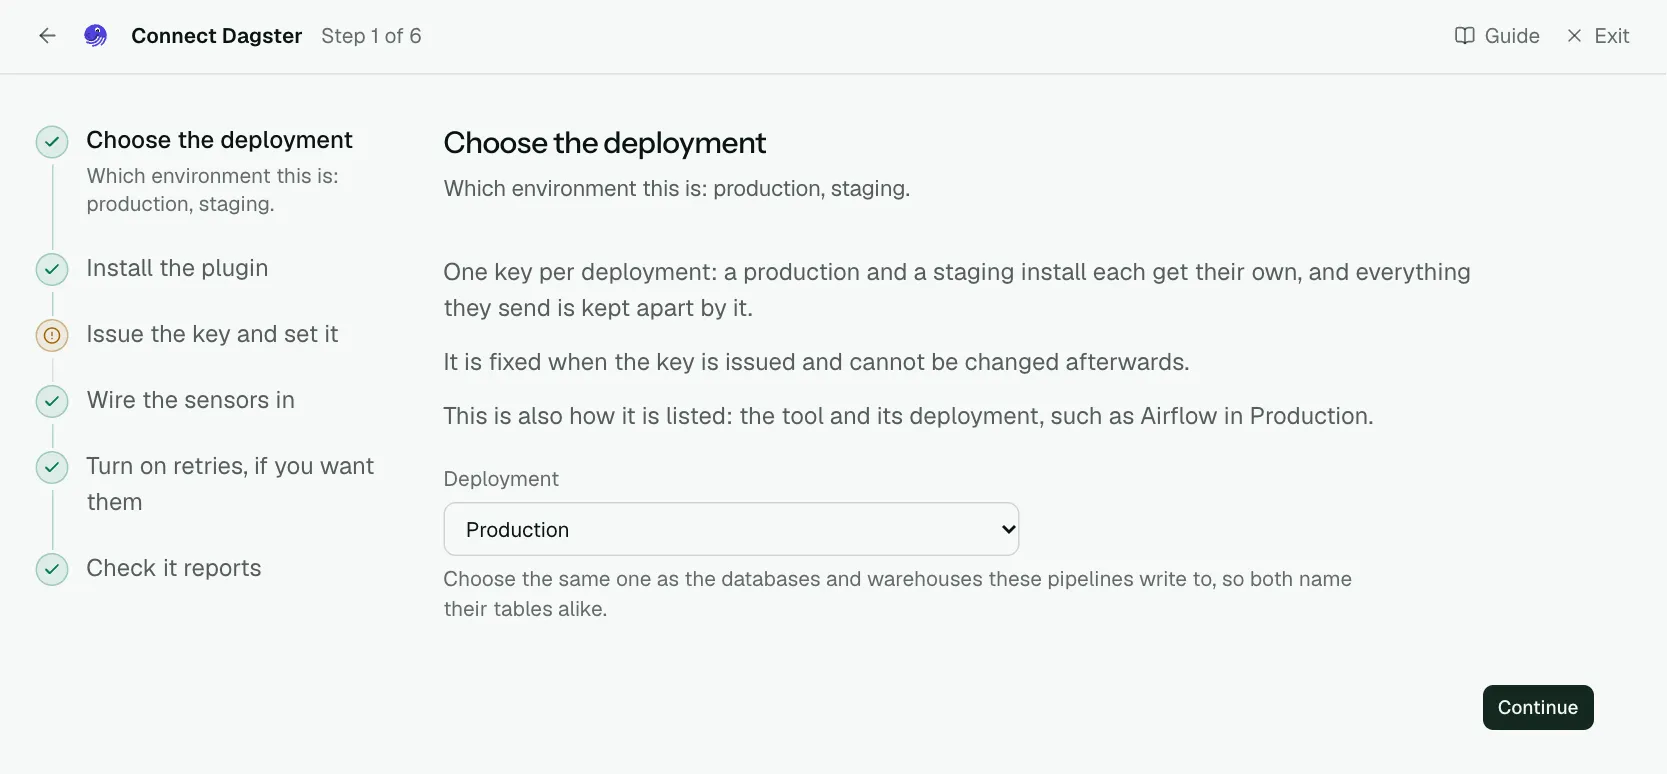
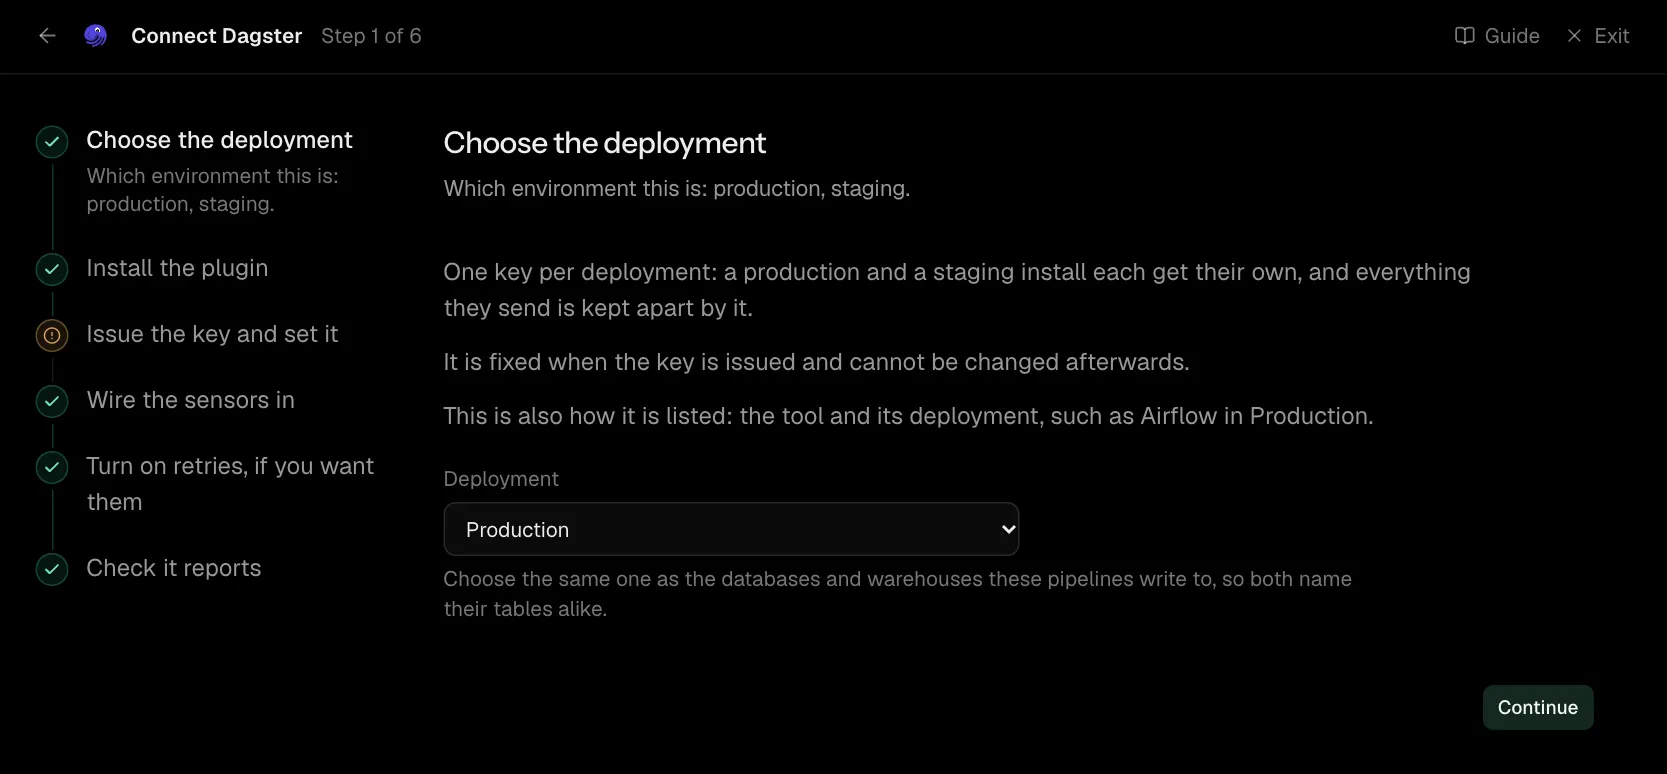
One key per deployment: a production and a staging install each get their own, and everything they send is kept apart by it.
It is fixed when the key is issued and cannot be changed afterwards.
This is also how it is listed: the tool and its deployment, such as Airflow in Production.
| What it asks for | Needed | What to enter |
|---|---|---|
| Deployment | Yes | Choose the same one as the databases and warehouses these pipelines write to, so both name their tables alike. Choose one of: Production, Staging, Development, Test, Quality assurance, User acceptance, Pre-production, Sandbox. |
Step 2 of 6: Install the plugin
Add convalesce-emit-dagster to your code location.
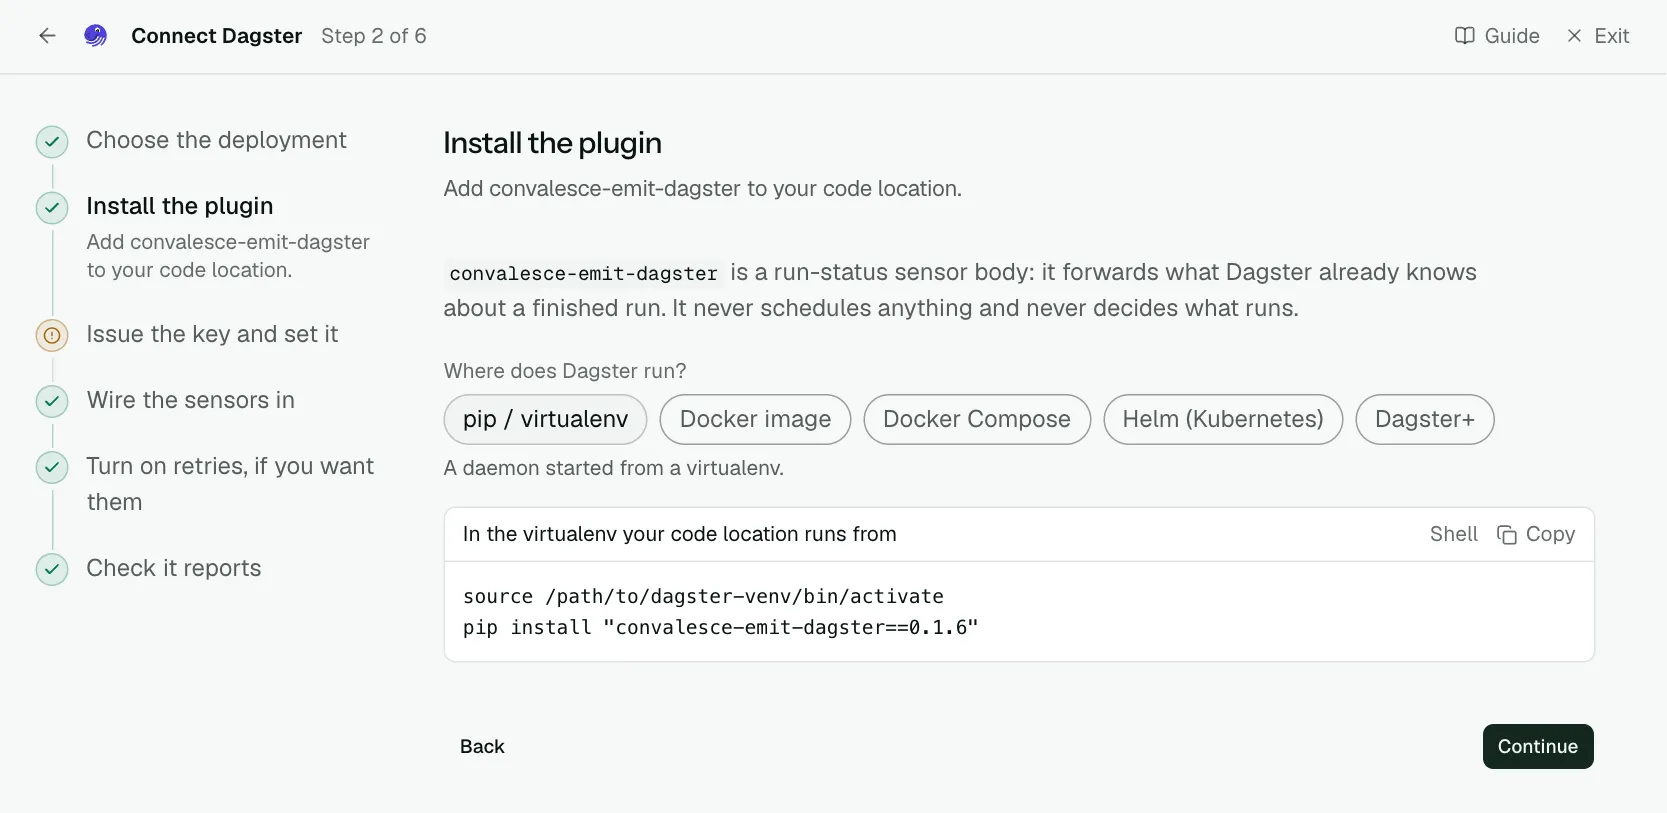
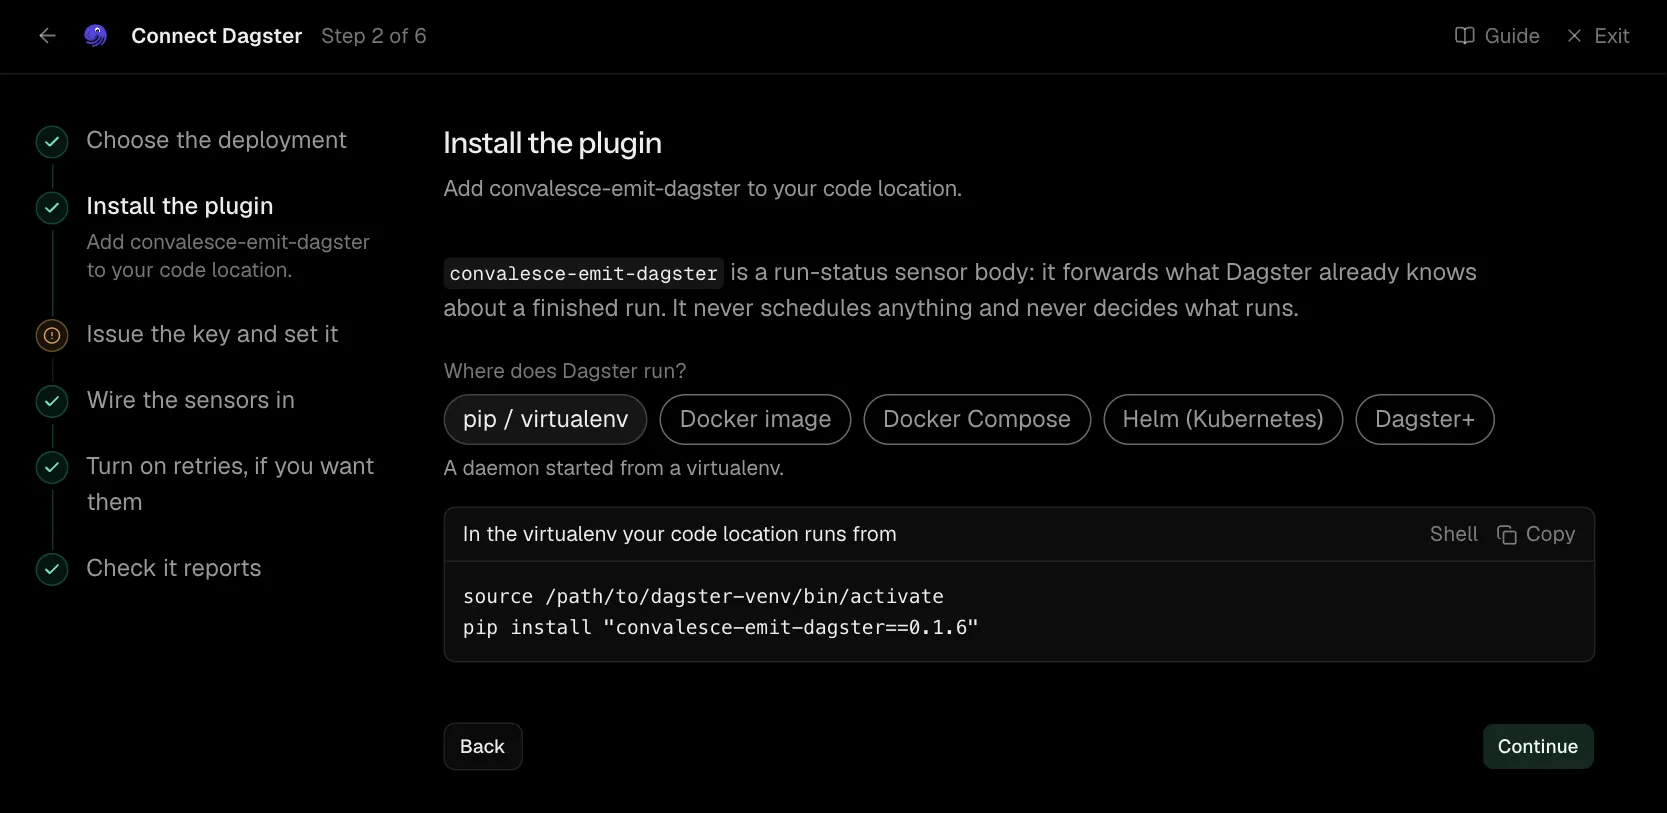
convalesce-emit-dagster is a run-status sensor body: it forwards what Dagster already knows about a finished run. It never schedules anything and never decides what runs.
source /path/to/dagster-venv/bin/activate
pip install "convalesce-emit-dagster==0.2.1"
Step 3 of 6: Issue the key and set it
Point the daemon at Convalesce.
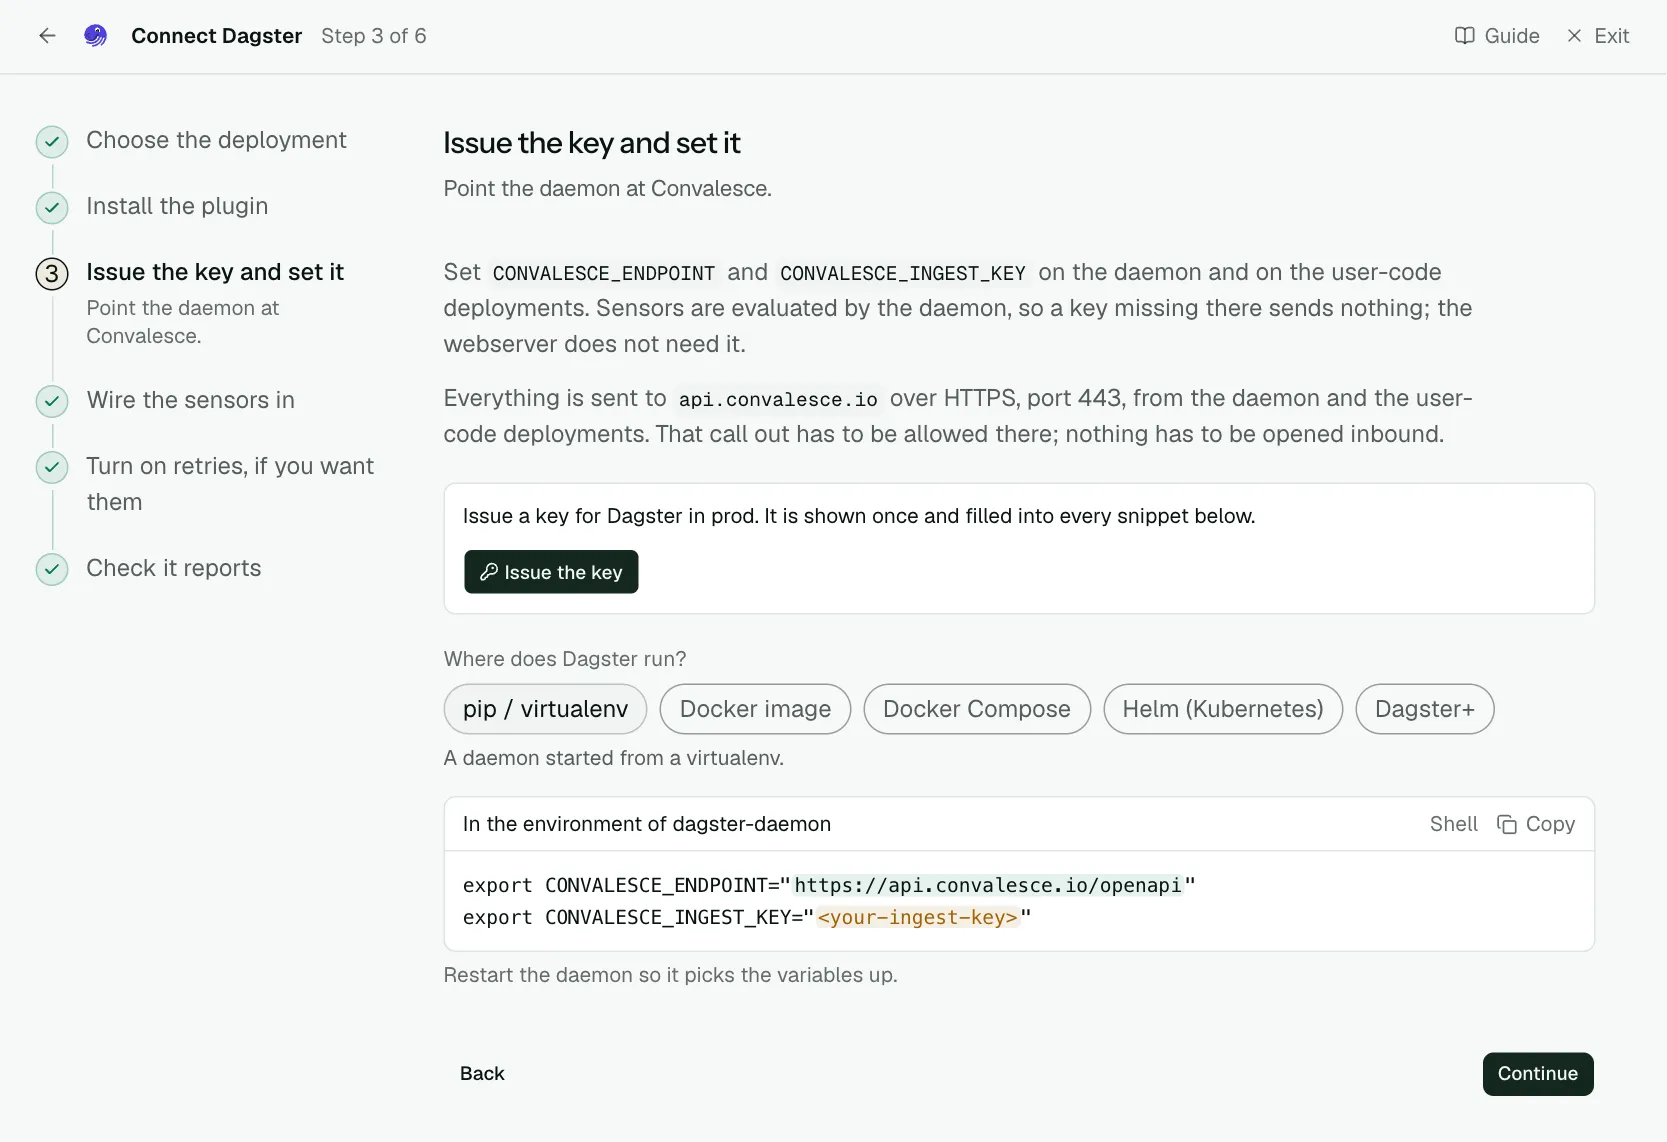
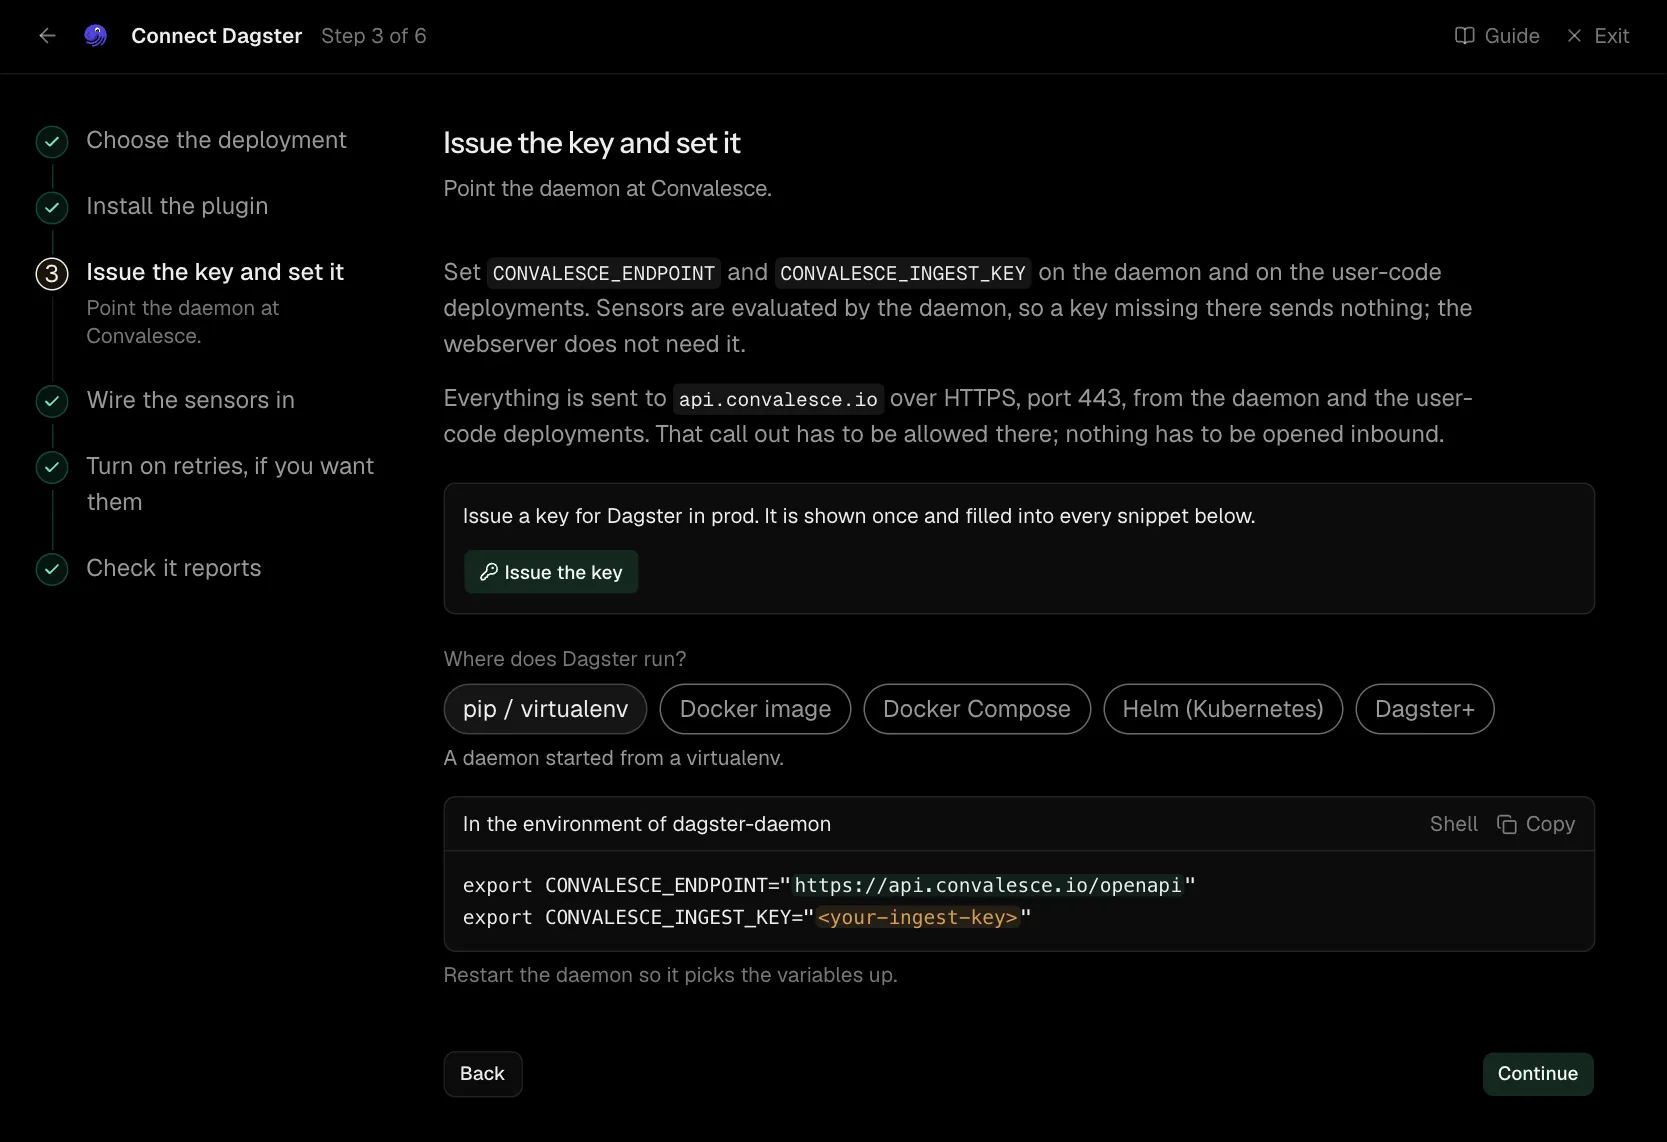
Set CONVALESCE_ENDPOINT and CONVALESCE_INGEST_KEY on the daemon and on the user-code deployments. Sensors are evaluated by the daemon, so a key missing there sends nothing; the webserver does not need it.
With each step it sends the code the step ran, the SQL it ran (the statement text, never the values bound to it) and the config it ran with, with secrets masked. CONVALESCE_SEND_SOURCE, CONVALESCE_SQL_CAPTURE and CONVALESCE_SEND_ARGUMENTS each turn one of those off when set to false, where your steps and your sensors run.
Set CONVALESCE_DAGSTER_URL where your sensors run to the address you open the Dagster UI at, such as https://dagster.example.com, and each job, run and step in Convalesce links to its page in Dagster.
From the metadata on a materialisation it sends what describes the table, and every other entry that is a plain number, a true or false value or a time. CONVALESCE_DAGSTER_SEND_METADATA=false where your sensors run keeps those other entries back.
Everything is sent to api.convalesce.io over HTTPS, port 443, from the daemon and the user-code deployments. That call out has to be allowed there; nothing has to be opened inbound.
export CONVALESCE_ENDPOINT="https://api.convalesce.io/openapi"
export CONVALESCE_INGEST_KEY="<your-ingest-key>"
Restart the daemon so it picks the variables up.
Step 4 of 6: Wire the sensors in
Three run-status sensors: success, failure and cancelled.
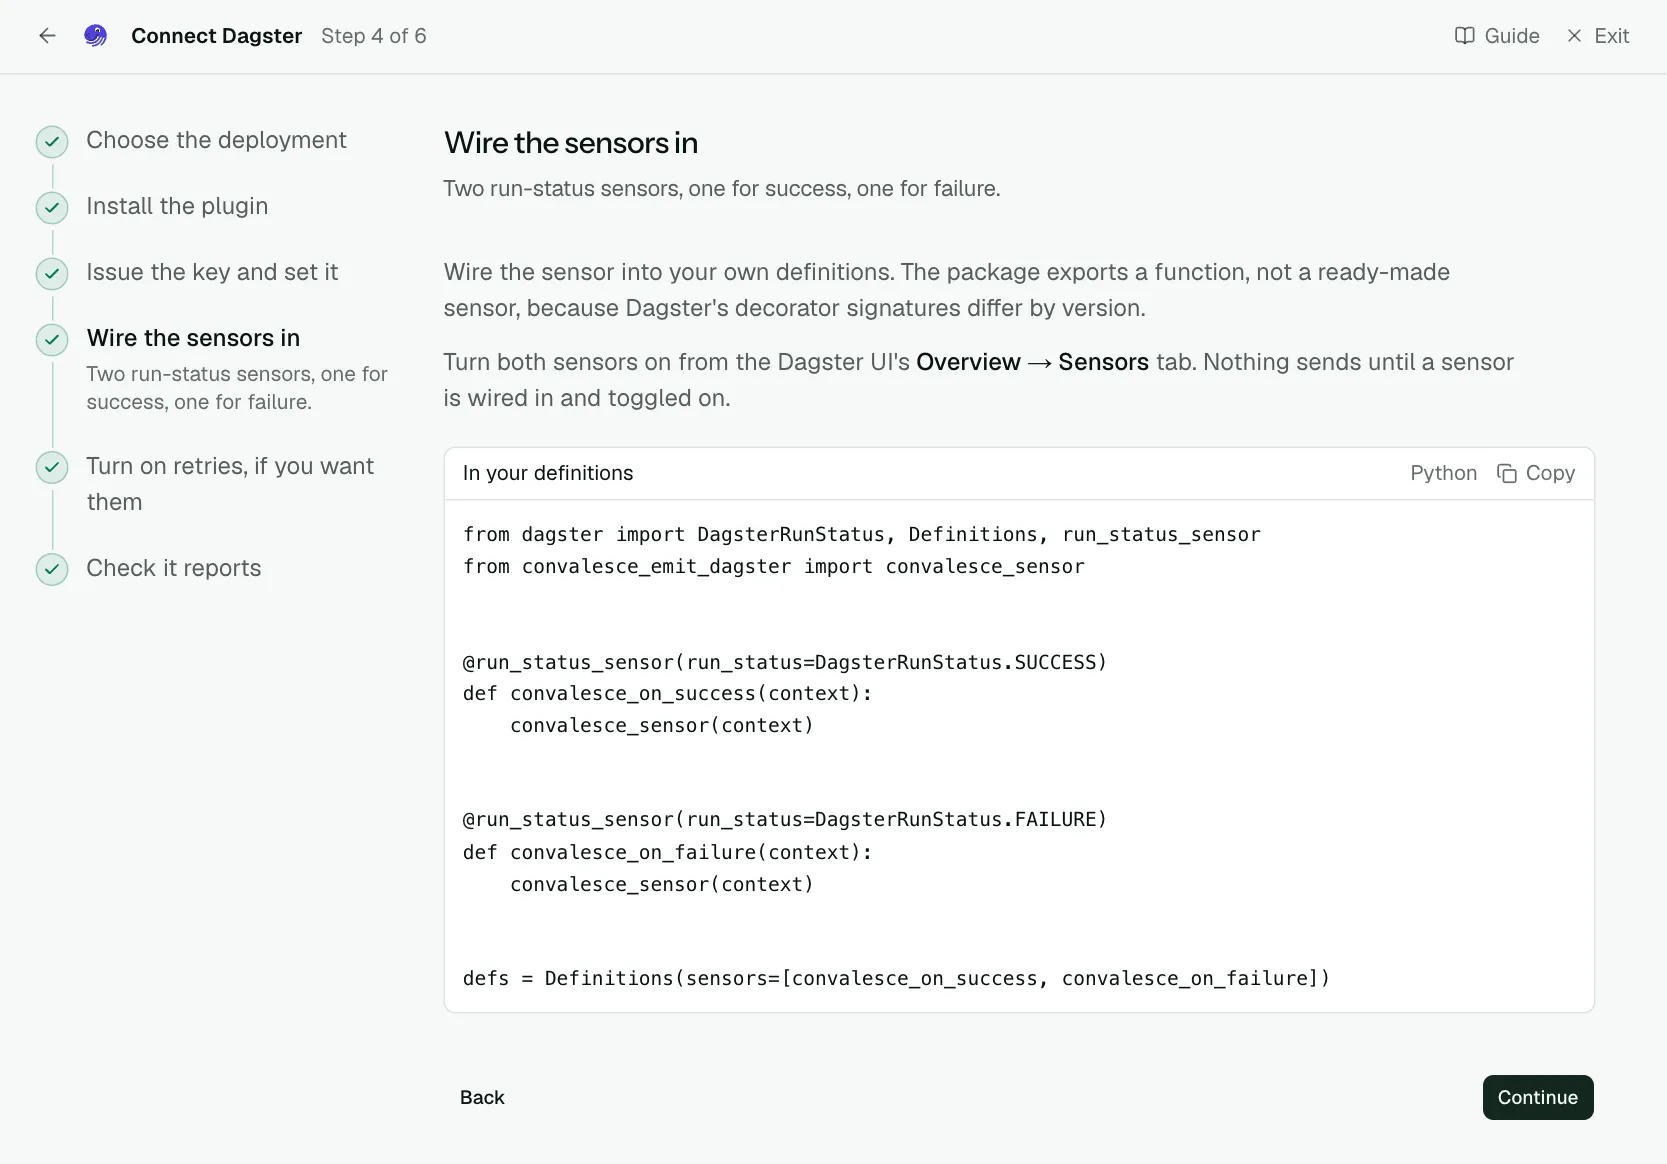
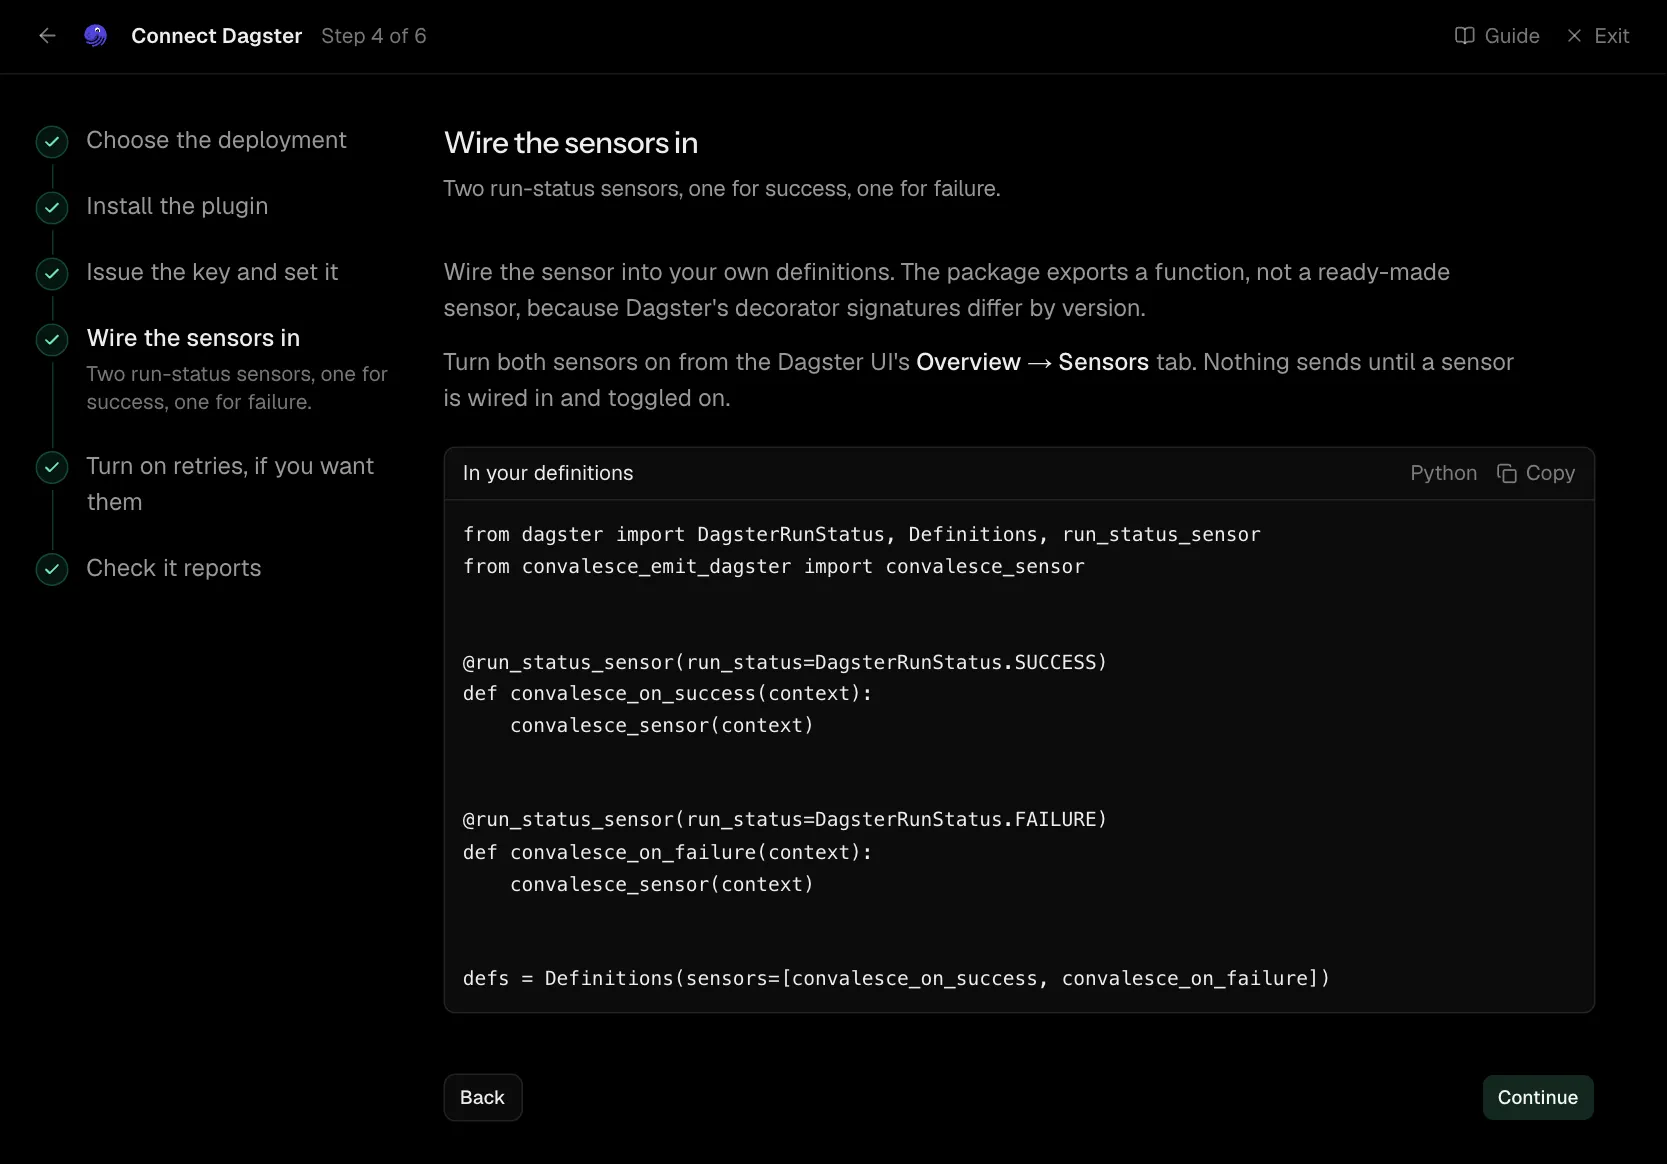
Wire the sensor into your own definitions. The package exports a function, not a ready-made sensor, because Dagster's decorator signatures differ by version.
Turn all three sensors on from the Dagster UI's Overview → Sensors tab. Nothing sends until a sensor is wired in and toggled on.
Importing the package where your definitions live is also what lets it see each step. A step that ran SQL or has config adds one line to the run's events in the Dagster UI: Convalesce noted what this step ran.
from dagster import DagsterRunStatus, Definitions, run_status_sensor
from convalesce_emit_dagster import convalesce_sensor


@run_status_sensor(run_status=DagsterRunStatus.SUCCESS)
def convalesce_on_success(context):
    convalesce_sensor(context)


@run_status_sensor(run_status=DagsterRunStatus.FAILURE)
def convalesce_on_failure(context):
    convalesce_sensor(context)


@run_status_sensor(run_status=DagsterRunStatus.CANCELED)
def convalesce_on_canceled(context):
    convalesce_sensor(context)


defs = Definitions(
    sensors=[convalesce_on_success, convalesce_on_failure, convalesce_on_canceled]
)
Step 5 of 6: Turn on retries, if you want them (optional)
Optional: let Dagster re-execute a run once somebody approves it.
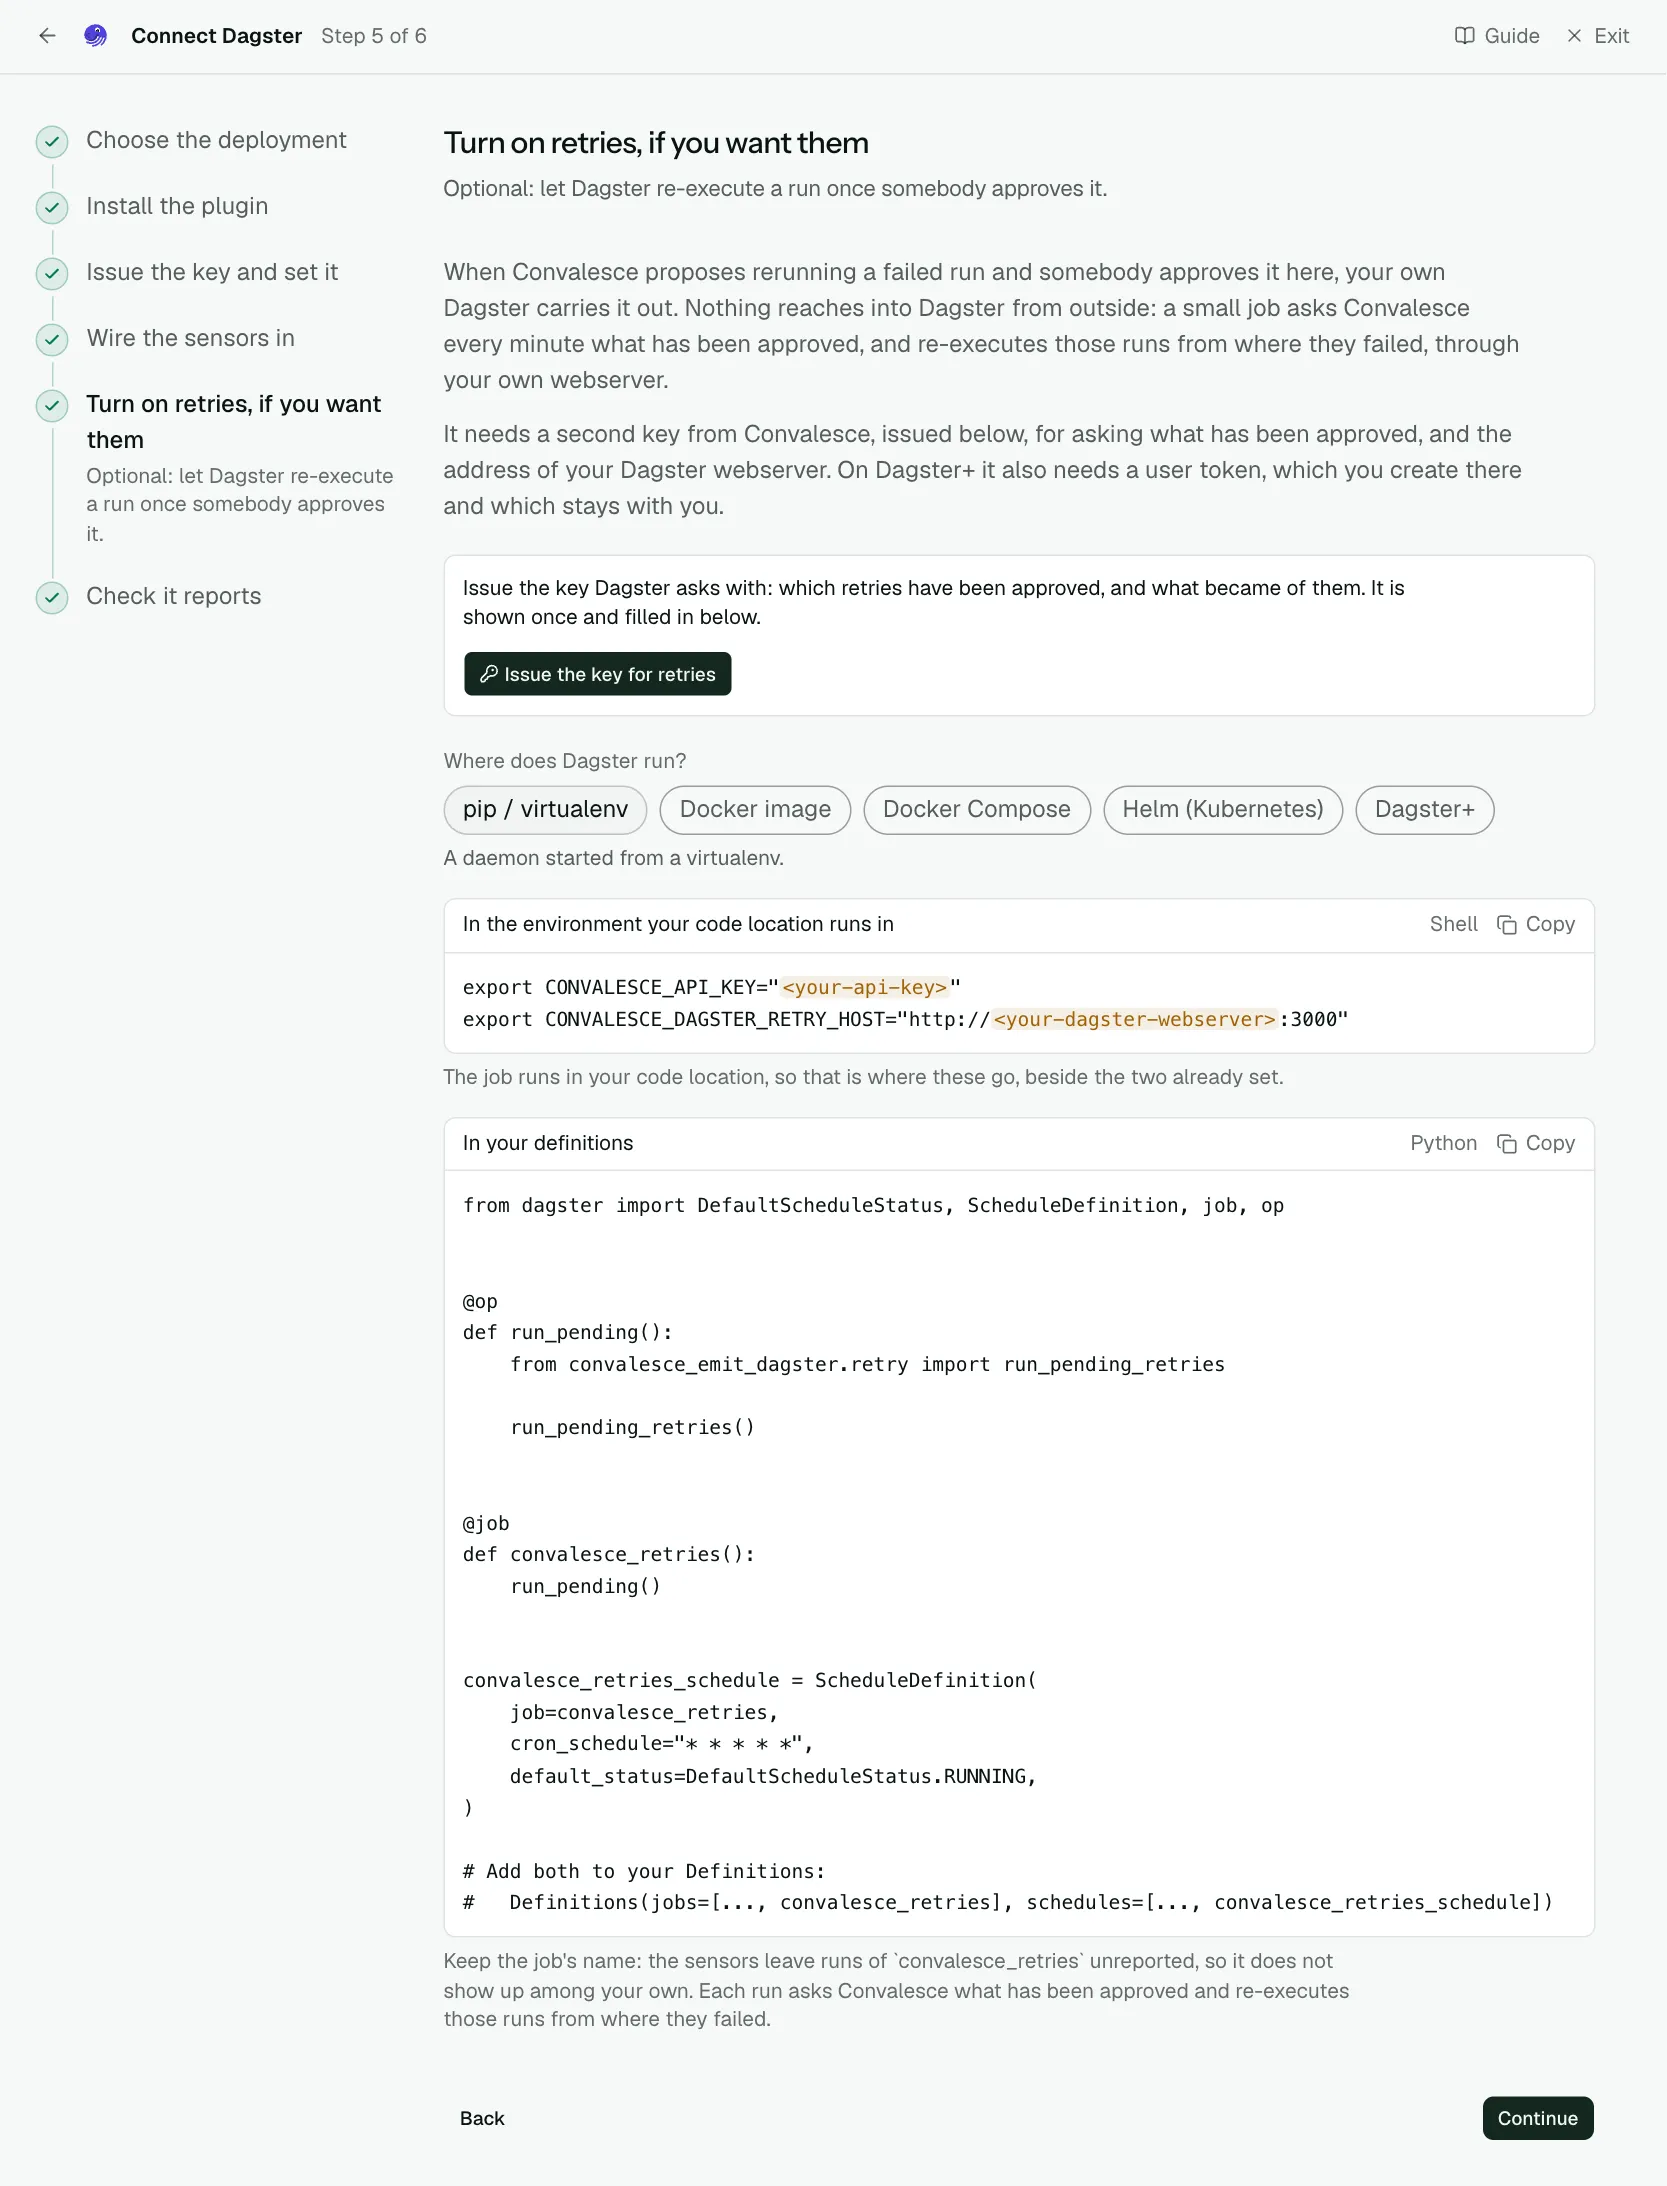
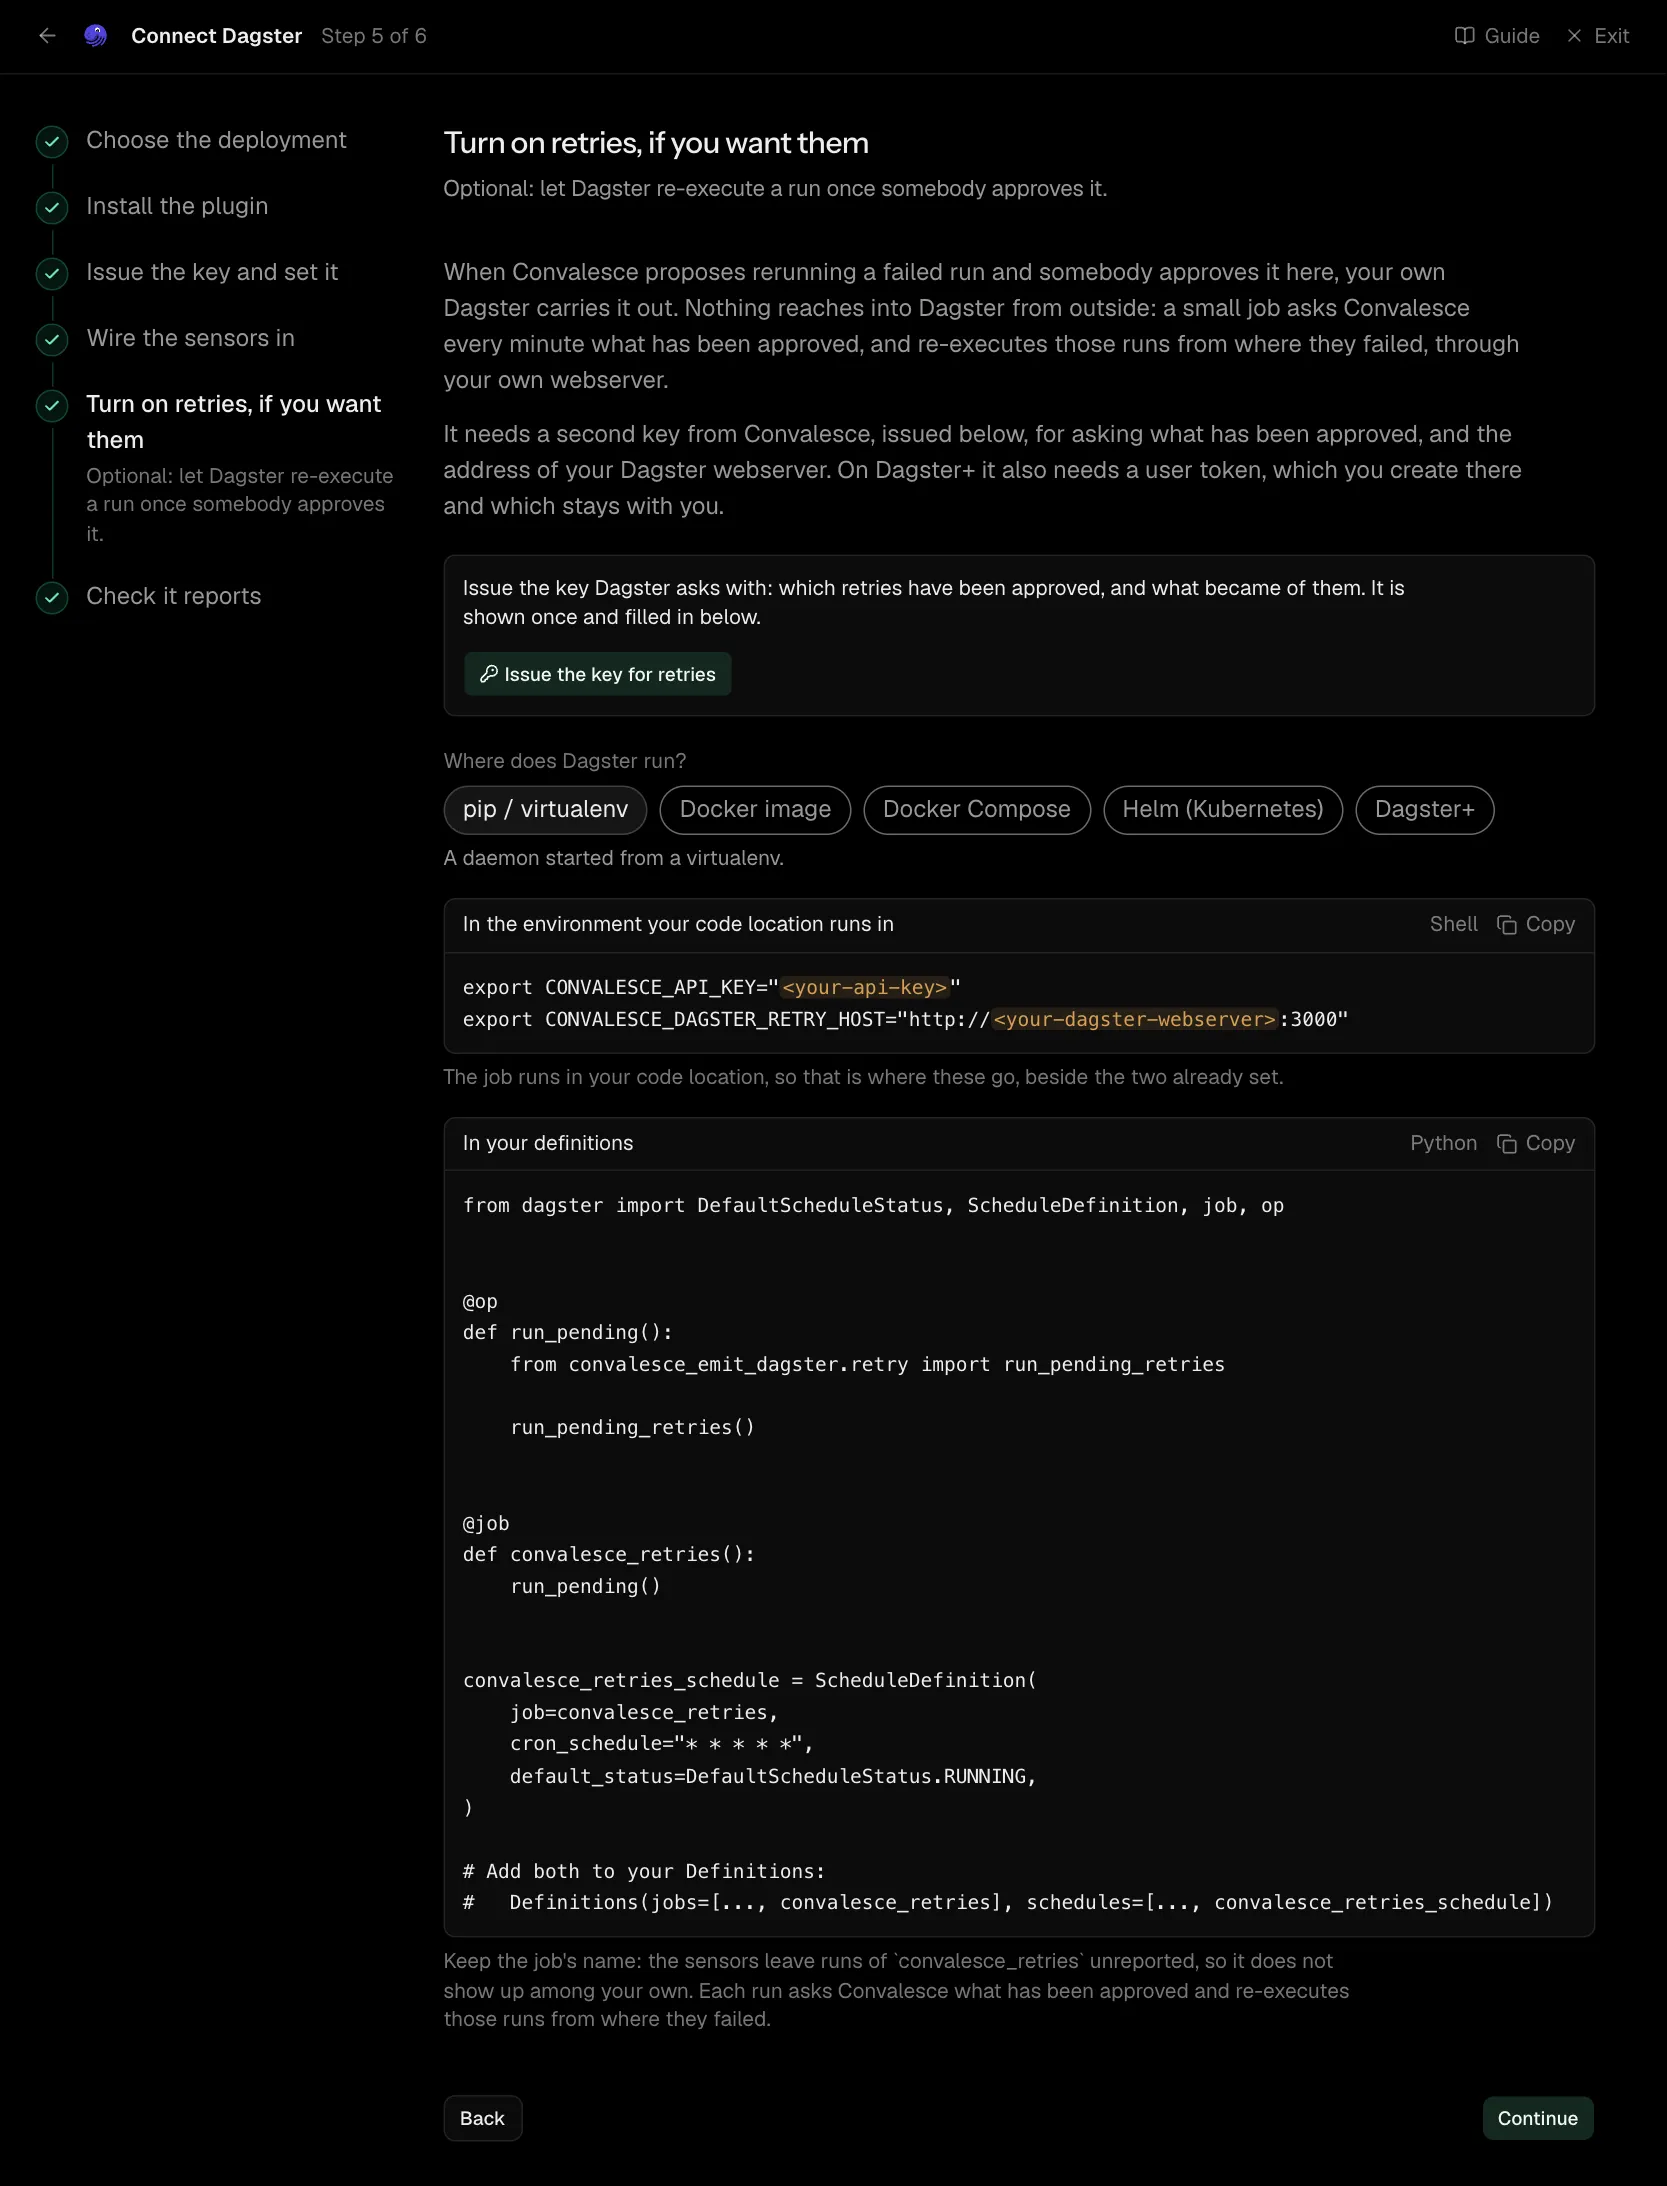
When Convalesce proposes rerunning a failed run and somebody approves it here, your own Dagster carries it out. Nothing reaches into Dagster from outside: a small job asks Convalesce every minute what has been approved for this deployment, with the key you have already set, and re-executes those runs from where they failed, through your own webserver.
It needs the address of your Dagster webserver. On Dagster+ it also needs a user token, which you create there and which stays with you.
export CONVALESCE_DAGSTER_RETRY_HOST="http://<your-dagster-webserver>:3000"The job runs in your code location, so that is where this goes, beside the two already set.
from dagster import DefaultScheduleStatus, ScheduleDefinition, job, op


@op
def run_pending():
    from convalesce_emit_dagster.retry import run_pending_retries

    run_pending_retries()


@job
def convalesce_retries():
    run_pending()


convalesce_retries_schedule = ScheduleDefinition(
    job=convalesce_retries,
    cron_schedule="* * * * *",
    default_status=DefaultScheduleStatus.RUNNING,
)

# Add both to your Definitions:
#   Definitions(jobs=[..., convalesce_retries], schedules=[..., convalesce_retries_schedule])
Keep the job's name: the sensors leave runs of convalesce_retries unreported, so it does not show up among your own. Each run asks Convalesce what has been approved for this deployment and re-executes those runs from where they failed.
Step 6 of 6: Check it reports
Run something and watch the first event arrive.
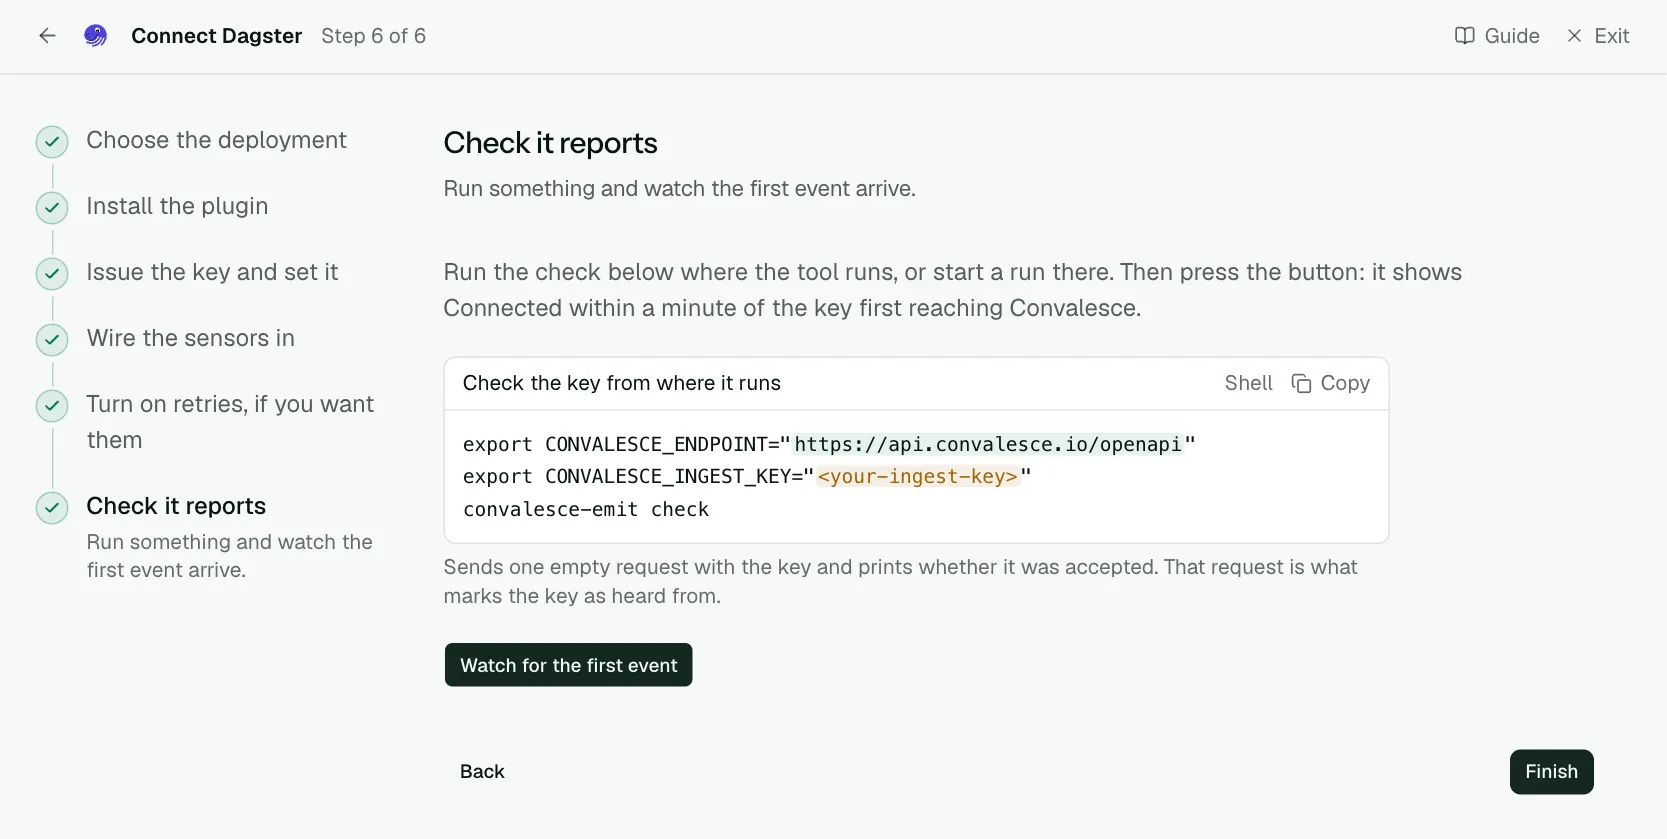
Run the check below where the tool runs, or start a run there. Then press the button: it shows Connected within a minute of the key first reaching Convalesce.
Network
Everything is sent to api.convalesce.io over HTTPS, port 443, from the daemon and the user-code deployments. That call out has to be allowed there; nothing has to be opened inbound.
Retries
| What | Who sets it | What it is for |
|---|---|---|
CONVALESCE_DAGSTER_RETRY_HOST | You | The address of your Dagster webserver. On Dagster+, the address you open the deployment at. |
CONVALESCE_DAGSTER_RETRY_TOKEN | You, in Dagster+ | A Dagster+ user token. Needed on Dagster+ only. |
The job asks Convalesce with the key you have already set. The Turn on retries step writes these for the way you run Dagster, and the job and schedule to add.
What is sent
With each run, the plugin sends what every step did:
- The code that ran: the source of the op or asset function behind the step.
- The SQL it ran: the text of each statement sent through SQLAlchemy or a database driver. The values bound to a statement and the rows it read or wrote stay with you.
- What it was called with: the config the step ran with. Secrets are masked.
Each of the three is on by default and has its own switch in Settings. false, 0, no and off all turn a switch off. Set them where your steps and your sensors run.
Metadata on an asset
From the metadata on a materialisation, an observation, an asset check or a failure, the plugin sends:
- What describes the table: row counts, the table name, the column schema and column lineage, the code version and the SQL an asset ran.
- Plain values: every other entry that is a number, a true or false value or a time, under its own name. Up to 50 for each event.
Text, markdown, JSON, tables, paths and links are sent as a count.
Set CONVALESCE_DAGSTER_SEND_METADATA=false where your sensors run to send only what describes the table.
Links to the Dagster UI
Set CONVALESCE_DAGSTER_URL where your sensors run to the address you open the Dagster UI at, such as https://dagster.example.com. Each job, op, run and step in Convalesce then links to its page in Dagster.
On Dagster+ use the address of your organisation, such as https://my-org.dagster.cloud. The link goes through the deployment the run ran in, including a branch deployment.
Naming what an op reads and writes
An asset names its own table. For an op, pass its inputs and outputs to the sensor with the lineage= keyword, keyed by op name:
LINEAGE = {
    "load_orders": {
        "inputs": ["s3://my-bucket/exports/orders"],
        "outputs": ["s3://my-bucket/warehouse/orders"],
    },
}


@run_status_sensor(run_status=DagsterRunStatus.SUCCESS)
def convalesce_on_success(context):
    convalesce_sensor(context, lineage=LINEAGE)
lineage can also be a function that takes the sensor's context and returns the same mapping, for a declaration that depends on the run.
The line in the run's events
A step that ran SQL or has config adds one line to the run's events in the Dagster UI: Convalesce noted what this step ran. That line is how the sensor reads back what the step did. It starts when your definitions import convalesce_emit_dagster, which they already do for the sensors.
Settings
All of these are environment variables, read where the plugin runs.
| Variable | Default | What it does |
|---|---|---|
CONVALESCE_INGEST_KEY | required | The key the plugin presents. Issued on the connect screen and shown once. |
CONVALESCE_ENDPOINT | required | Where it sends: https://api.convalesce.io/openapi. The connect screen fills it into every snippet. |
CONVALESCE_ENABLED | true | Set false to pause sending without uninstalling. |
CONVALESCE_DRY_RUN | false | Set true to log what would be sent and send nothing. |
CONVALESCE_TIMEOUT | 10 | Seconds to wait on one request. |
CONVALESCE_MAX_RETRIES | 3 | Attempts after the first, when a request fails for a passing reason. |
CONVALESCE_BATCH_SIZE | 50 | The most observations sent in one request. |
CONVALESCE_MAX_BODY_BYTES | 1000000 | Largest request it sends. Up to 5000000. |
CONVALESCE_SPOOL_DIR | a folder under the system temp directory | Where anything that could not be delivered waits, to be sent on a later attempt. |
CONVALESCE_SPOOL_MAX_BYTES | 1000000000 | The most that folder holds. |
CONVALESCE_SEND_SOURCE | true | Set false to stop sending the code that ran. |
CONVALESCE_SQL_CAPTURE | true | Set false to stop sending the SQL that ran. |
CONVALESCE_SEND_ARGUMENTS | true | Set false to stop sending the config each step ran with. |
CONVALESCE_DAGSTER_URL | for links | The address you open the Dagster UI at. |
CONVALESCE_DAGSTER_SEND_METADATA | true | Set false to stop sending the plain values an asset's author attached. |
CONVALESCE_DAGSTER_RETRY_HOST | for retry | Your Dagster webserver's address. |
CONVALESCE_DAGSTER_RETRY_TOKEN | for retry on Dagster+ | A Dagster+ user token, created in Dagster+. |
Versions
Dagster 1.7 through 1.13, on Python 3.9 and later. The latest release is convalesce-emit-dagster==0.2.1.
Troubleshooting
- The check step keeps waiting. All three sensors have to be switched on in Overview → Sensors. A sensor that is wired in and left off sends nothing.
- Nothing arrives after a run. The two variables have to be on the daemon and on the user-code deployments. Restart them after setting.
- An approved retry is not carried out. The
convalesce_retriesschedule has to be running, and the job's log says why it skipped one.